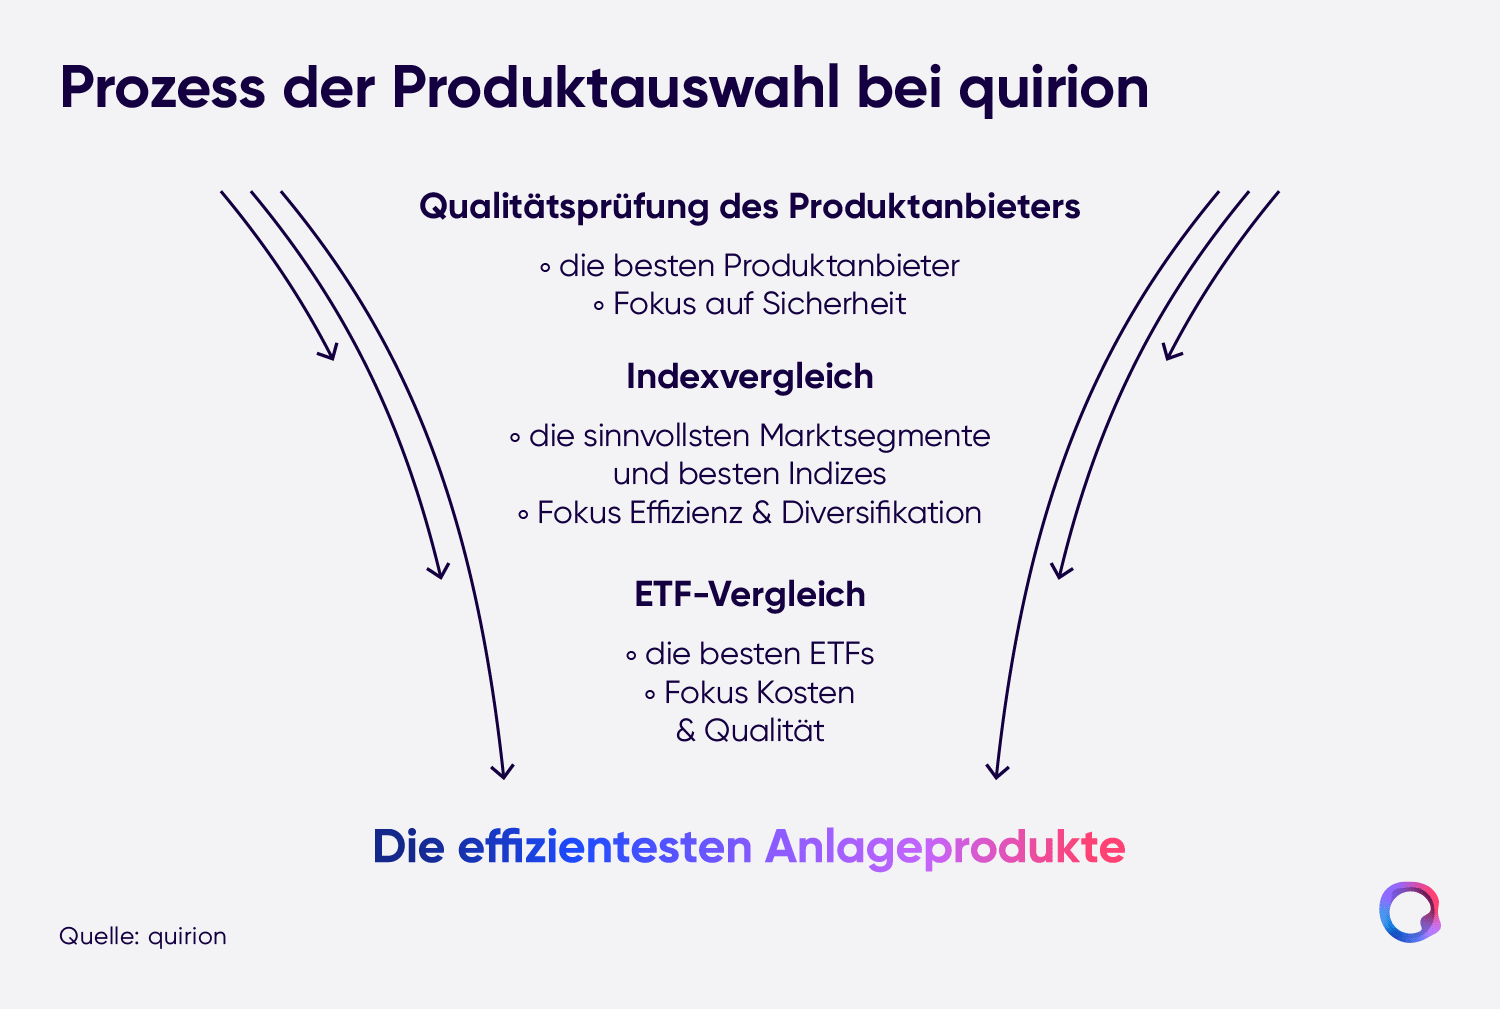
Even when ETFs track the performance of the same stock index, there can be big differences between them – for example in ongoing product costs and in quality. Selecting the most efficient ETFs for your own investment strategy is therefore no sure thing.
From time to time, ESMA (the European Securities and Markets Authority) takes a close look at the average costs of funds in the EU. And it finds – not entirely surprisingly – large differences between actively managed funds and ETFs again and again. According to the latest analysis, in 2020 there were 1.2 percentage points between ETFs (0.2 percent p.a.) and active funds (1.4 percent p.a.) for equity products. On average, then, active funds were seven times as expensive.
ETFs are cheap, offer a certain amount of diversification and thus make investing simpler. More or less all of them have that in common. But the range on offer is large, and on closer inspection you can find quite considerable differences even among ETFs that track the same stock index. Kai Hattwich, ETF expert at Quirin Privatbank and quirion, gives an example: "A few weeks ago I compared two ETFs on the MSCI World; despite identical product costs, their performance was 0.17 percentage points apart per year. That carries weight, especially over the long term."
Keeping an eye on the real costs
The quality with which an ETF replicates index performance is a decisive selection criterion. To capture this more precisely, quirion has developed its own metric, namely the "real costs." Deviations between the ETF's development and the index's development feed into it in particular. It therefore reflects all costs, including for example the trading costs of securities that arise within the ETFs. The Total Expense Ratio (TER) that is usually cited for ongoing product costs does not capture these and is limited to costs for the "infrastructure," such as connecting to trading systems, or custodian-bank and licensing fees.
Because the Total Expense Ratio is a particularly common metric for ongoing product costs, you can go online at quirion and get an impression of the products' TERs that are used in the global portfolios. Important: the costs stated there are not to be equated with those of quirion's global portfolios. That is because comparatively cheap ETFs, such as those on blue chips from industrialised countries, carry a high weight in the portfolios. Taking the weighting into account, the range of product costs for the global portfolios lies on average between 0.13 and 0.19 percent per year. "For a portfolio with 50 percent equities and 50 percent bonds, for example, they currently come to 0.17 percent," Hattwich explains.
Bringing the investment strategy into the accounts
As far as ongoing costs go, bond ETFs are generally somewhat cheaper than equity ETFs. "It is easier to replicate the interest-rate structure than the performance of a large equity index," Hattwich notes. For an equity ETF, many individual securities may need to be traded. "Beyond that, competition among indices on bonds is greater than among those on equities, where a few index providers dominate the market."
Among equities, ETFs on blue chips from industrialised countries are in turn cheaper than products that are less frequently in demand – such as those on small caps from emerging markets. Trading equities across many different emerging markets requires a more expensive infrastructure. But such ETFs, too, are indispensable for the global portfolios. Because working together, the ETFs have to implement the investment strategy in the best possible way.
In principle, the same criteria apply to quirion's sustainable portfolios as to the global portfolios. "Here we then additionally factor ecological and social aspects into the product selection," Hattwich explains. "There are indeed more and more ETFs that we can consider for this. But the segment is still young and the choice is far more limited than for the global portfolios," Hattwich says. For the sustainable portfolios, product costs are therefore somewhat higher, averaging between 0.20 and 0.28 percent per year when the weighting is taken into account.
The pitfalls in the details
With ETFs, ongoing product costs feed into performance and are not billed separately. "That is generally the case and applies regardless of other fees – so also if you buy an ETF yourself via some platform," Hattwich notes. That does not necessarily make it easier for investors to take all the details into account and keep an eye on them when making their own selection.
At quirion, investors do not even have to deal with it in the first place. All aspects of the selection are reviewed regularly here. Where necessary, ETFs are then swapped out, usually during the rebalancing of the portfolios. The time had just come again. "We swapped out a number of products in the global portfolios," Hattwich notes. "As a result, the weighted average costs in some portfolios have fallen a little further."