





What is the TER?
The Total Expense Ratio is a metric intended to indicate the costs incurred each year in managing an actively managed investment fund or an ETF (Exchange Traded Fund). It is therefore a metric that shows how efficiently a fund is managed. Low costs are particularly important with long-term investments or savings plans, because even small differences in cost can, through the compound interest effect, have a marked impact over the years.
In Germany, investment companies are legally obliged to state the TER (as a percentage). Anyone who distributes an active fund or ETF in Germany must therefore determine and disclose this metric. For the sake of better comparability, it is meant to be calculated in a standardised way. The Bundesverband der Investmentgesellschaften (BVI, the German Investment Funds Association) recommends in a guideline which costs should be included in the TER for funds distributed in Germany.
The method of calculation can, however, differ from country to country. If investors want to compare the costs of different funds with one another, it therefore makes sense to use figures from documents that were published for the same country.
How is the total expense ratio calculated?
To calculate the TER is quite straightforward once all the relevant costs are known. It is arrived at by taking the fund costs divided by the current fund assets.
So if a fund, for example, has relevant ongoing costs of five million euros per year and currently records a total volume of 800 million euros, the calculation is:
TER: 5,000,000 euros / 800,000,000 euros = 0.00625.
To obtain the percentage value, this figure is multiplied by 100 = 0.625 %.
The TER also makes it possible to roughly estimate how high the absolute costs are that, for example, a particular ETF causes. Someone who holds units worth 1,000 euros in an ETF with the TER mentioned above must factor in roughly 6.25 euros in annual costs (1,000 x 0.00625).
Which costs are included in the TER?
The total expense ratio includes the following costs, which are incurred each year:
- Administration costs: fees for managing the active fund/ETF
- Custodian bank fees
- other distribution and operating costs (e.g. auditors' fees for preparing an audited annual report, or advertising costs)
- for ETFs: licence fees for the index being tracked
Anyone who invests in an active fund or an ETF must therefore reckon with various ongoing costs to factor in. For example, the fund company has securities held in safekeeping at a separate custodian bank. It is also obliged to prepare an audited annual report. For this, the fund company must arrange an audit.
These costs are very similar for most funds. There can, however, be quite marked differences in the costs of management and also in the costs of advertising. In principle, funds with a high volume have an advantage here. Because of the high fund volume, the expenses are proportionately lower than with a small fund volume. In addition, management fees for ETFs are in principle considerably cheaper than for actively managed funds, which often record high costs for their elaborate forecast-based investment process (costs for the management team, technical and physical facilities, etc.).
Which costs are not included in the TER?
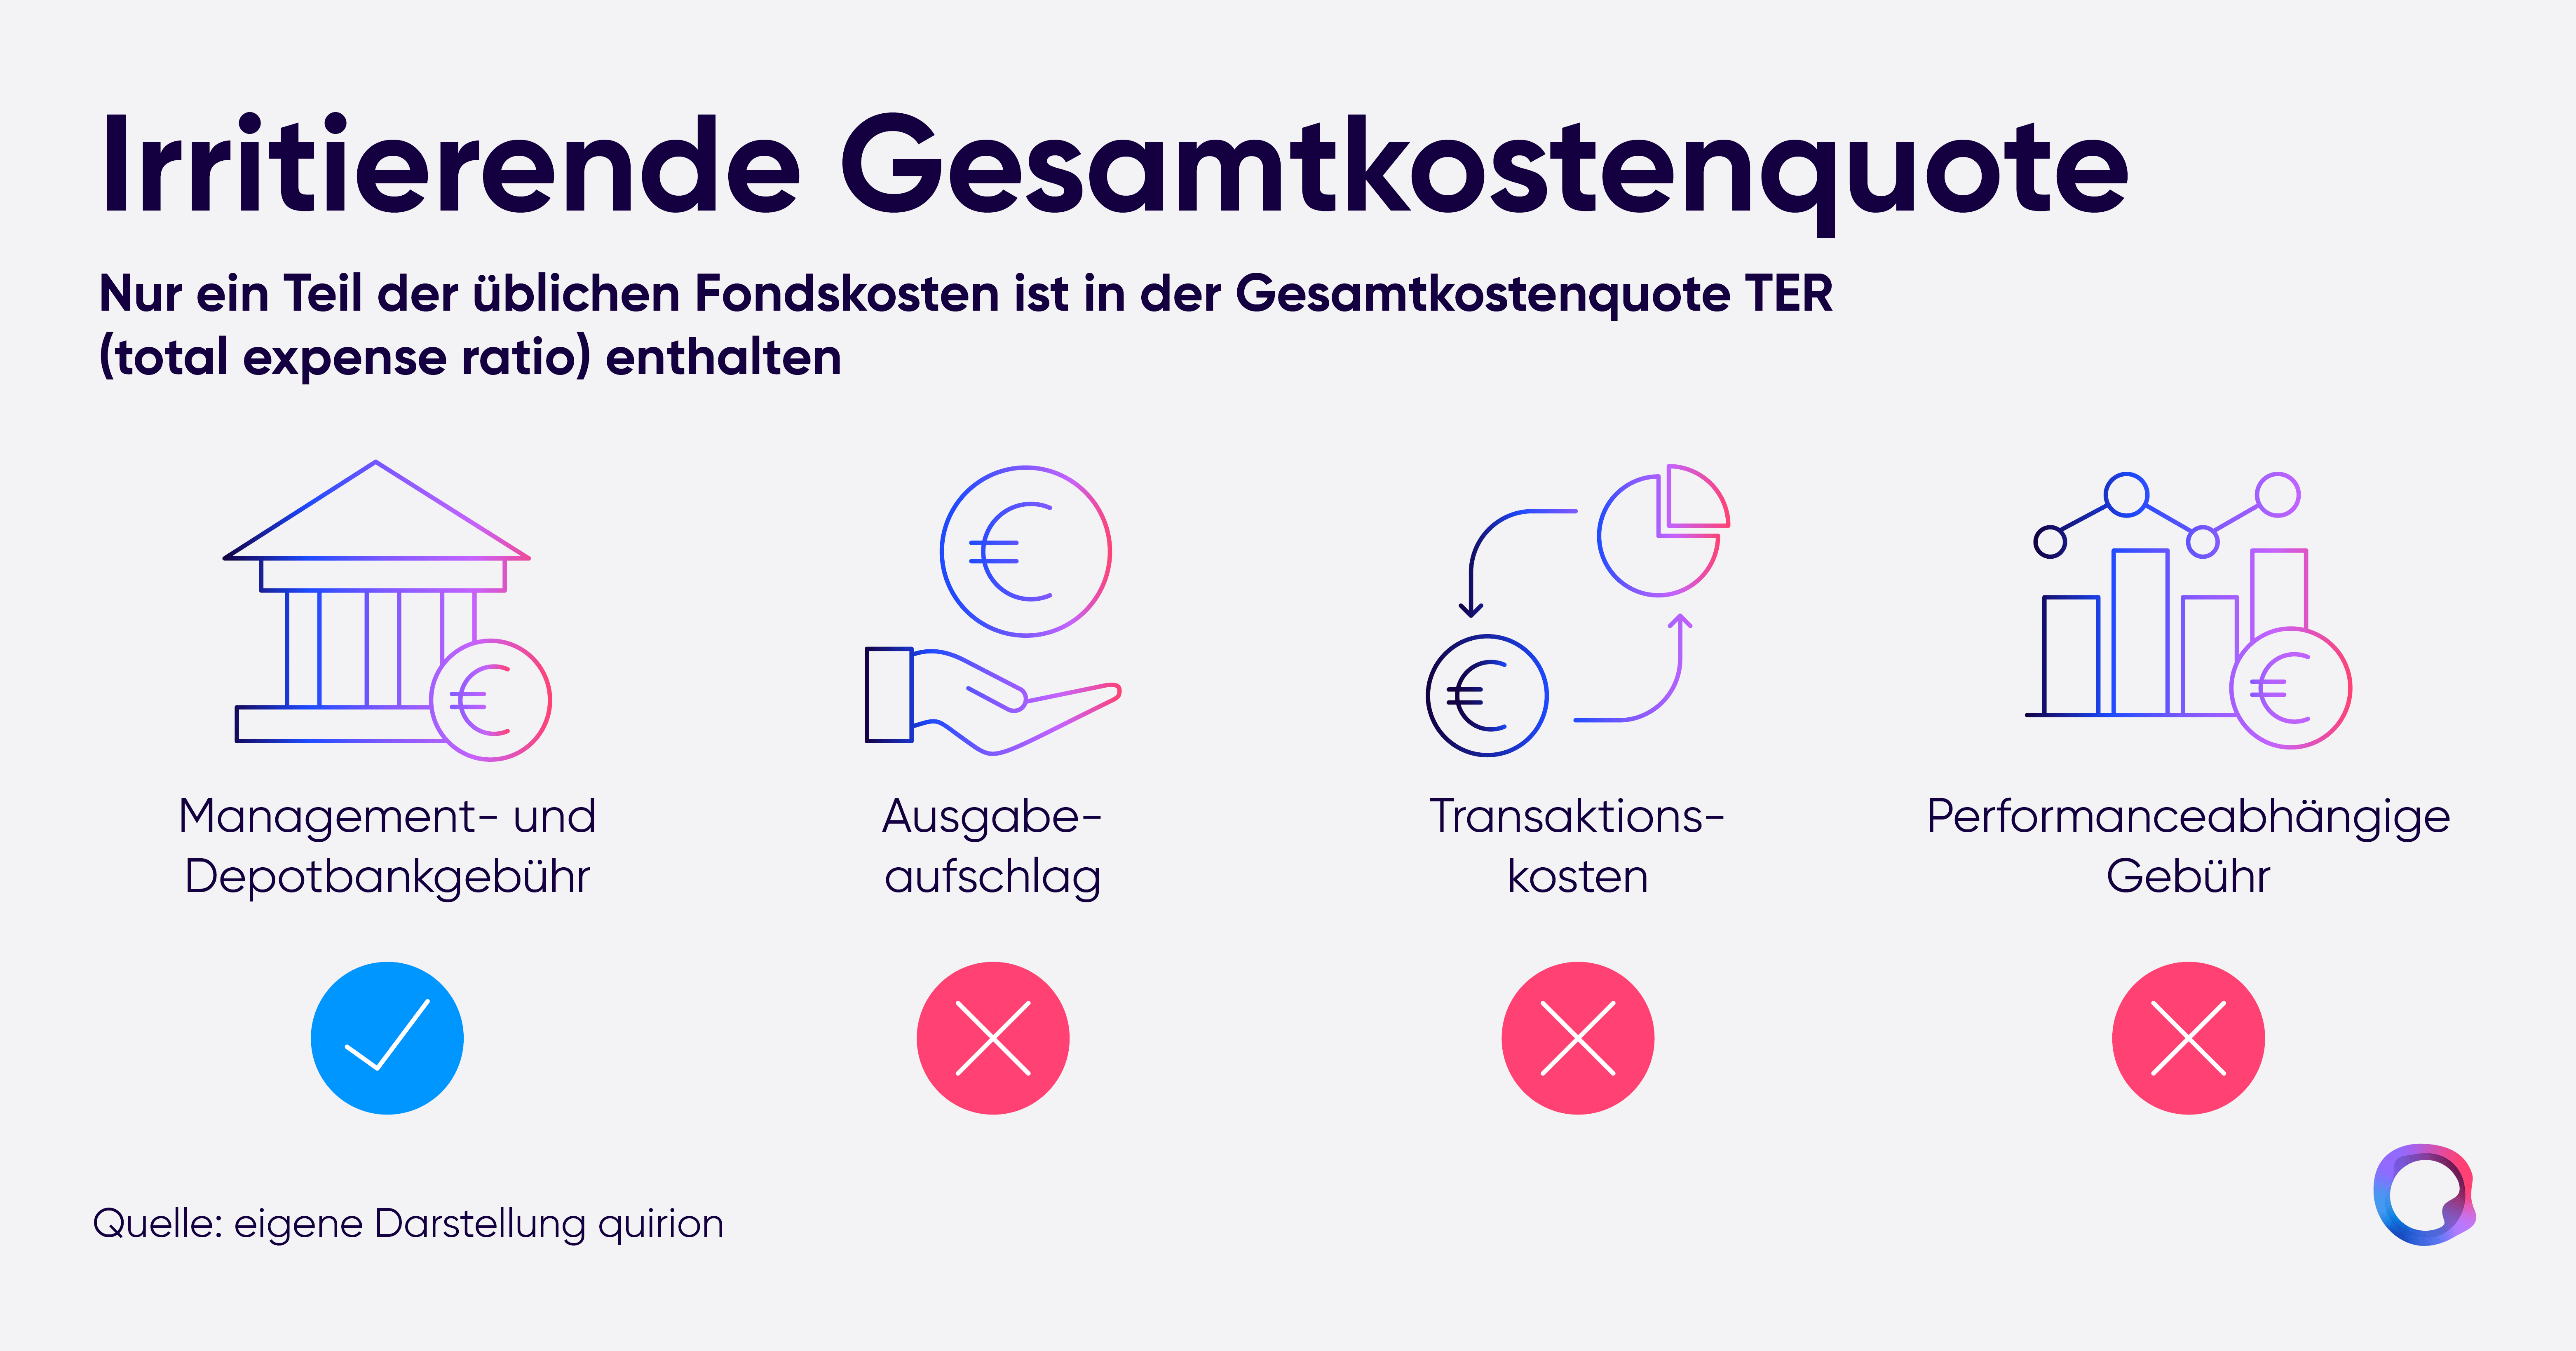
The TER does not include some costs. These include items such as:
- Transaction costs incurred when buying and selling securities
- performance-based fee on active funds
- swap fees on ETFs
- front-end load on active funds – this is not incurred annually but only once, at purchase; even so, it can significantly weigh on the fund's performance, especially in the first few years after purchase
These additional costs can represent a significant block of expenditure. Accordingly, the term “Total Expense Ratio”, or total expense ratio, is misleading, because after all not all costs are included. It is not uncommon for a supposedly low-cost fund with a correspondingly lower TER to end up performing worse in terms of returns than a fund with a higher total expense ratio. Above all the transaction costs, which arise from buying and selling e.g. equities or bonds, can inflate the actual costs, especially in the area of actively managed funds.
Cost-reducing, on the other hand, can be income from securities lent out by the fund. Should such income arise, however, it is likewise not taken into account in the TER.
Why is the TER, which does not cover all costs, useful at all?
Investors can certainly use the TER to gain an initial insight into the cost structure of a fund. It is only of limited informative value, but is nonetheless suitable for identifying, as a first step, very expensive fund products. Anyone who wants to assess the actual total costs must, however, take further cost items into account.
Investors should be aware, for example, that the transaction costs in particular can be relatively high with actively managed funds. Not infrequently they amount to 0.5 to 1.0 % p.a. With ETFs, transaction costs as a rule stay in the lower range of the second decimal place.
Get started today!
What alternatives to the Total Expense Ratio (TER for short) are there?
There are three metrics – albeit little known and hardly ever published – that are regarded as more precise than the total expense ratio when it comes to disclosing costs:
- Real Total Expense Ratio (realTER): in addition to the TER, this also covers transaction costs and performance-based fees, as well as all other costs at fund level. Because it is not subject to a legal publication requirement, investors essentially have to work out this metric laboriously themselves.
- Total Cost of Ownership (TCO): in addition to the realTER, this metric also covers the individual costs incurred on the investor's side. These can include costs for owning the fund, such as safekeeping of the securities at the custodian bank – or costs incurred for a stock exchange order. Because such costs can vary greatly from one individual to another, however, comparability is barely possible.
- Return difference (tracking difference) for ETFs: this is the deviation of an ETF's performance compared with the performance of the corresponding index. This view is very effective, because it more or less automatically takes into account all cost components but also income components (e.g. from securities lending). In doing so, it reveals weaknesses in index tracking and correspondingly high costs. The smaller an ETF's (performance) gap from its relevant index, the better and more cost-effectively the ETF is managed.
At quirion, considerations of the return difference feed into the ETF selection process.
How high is the TER usually?
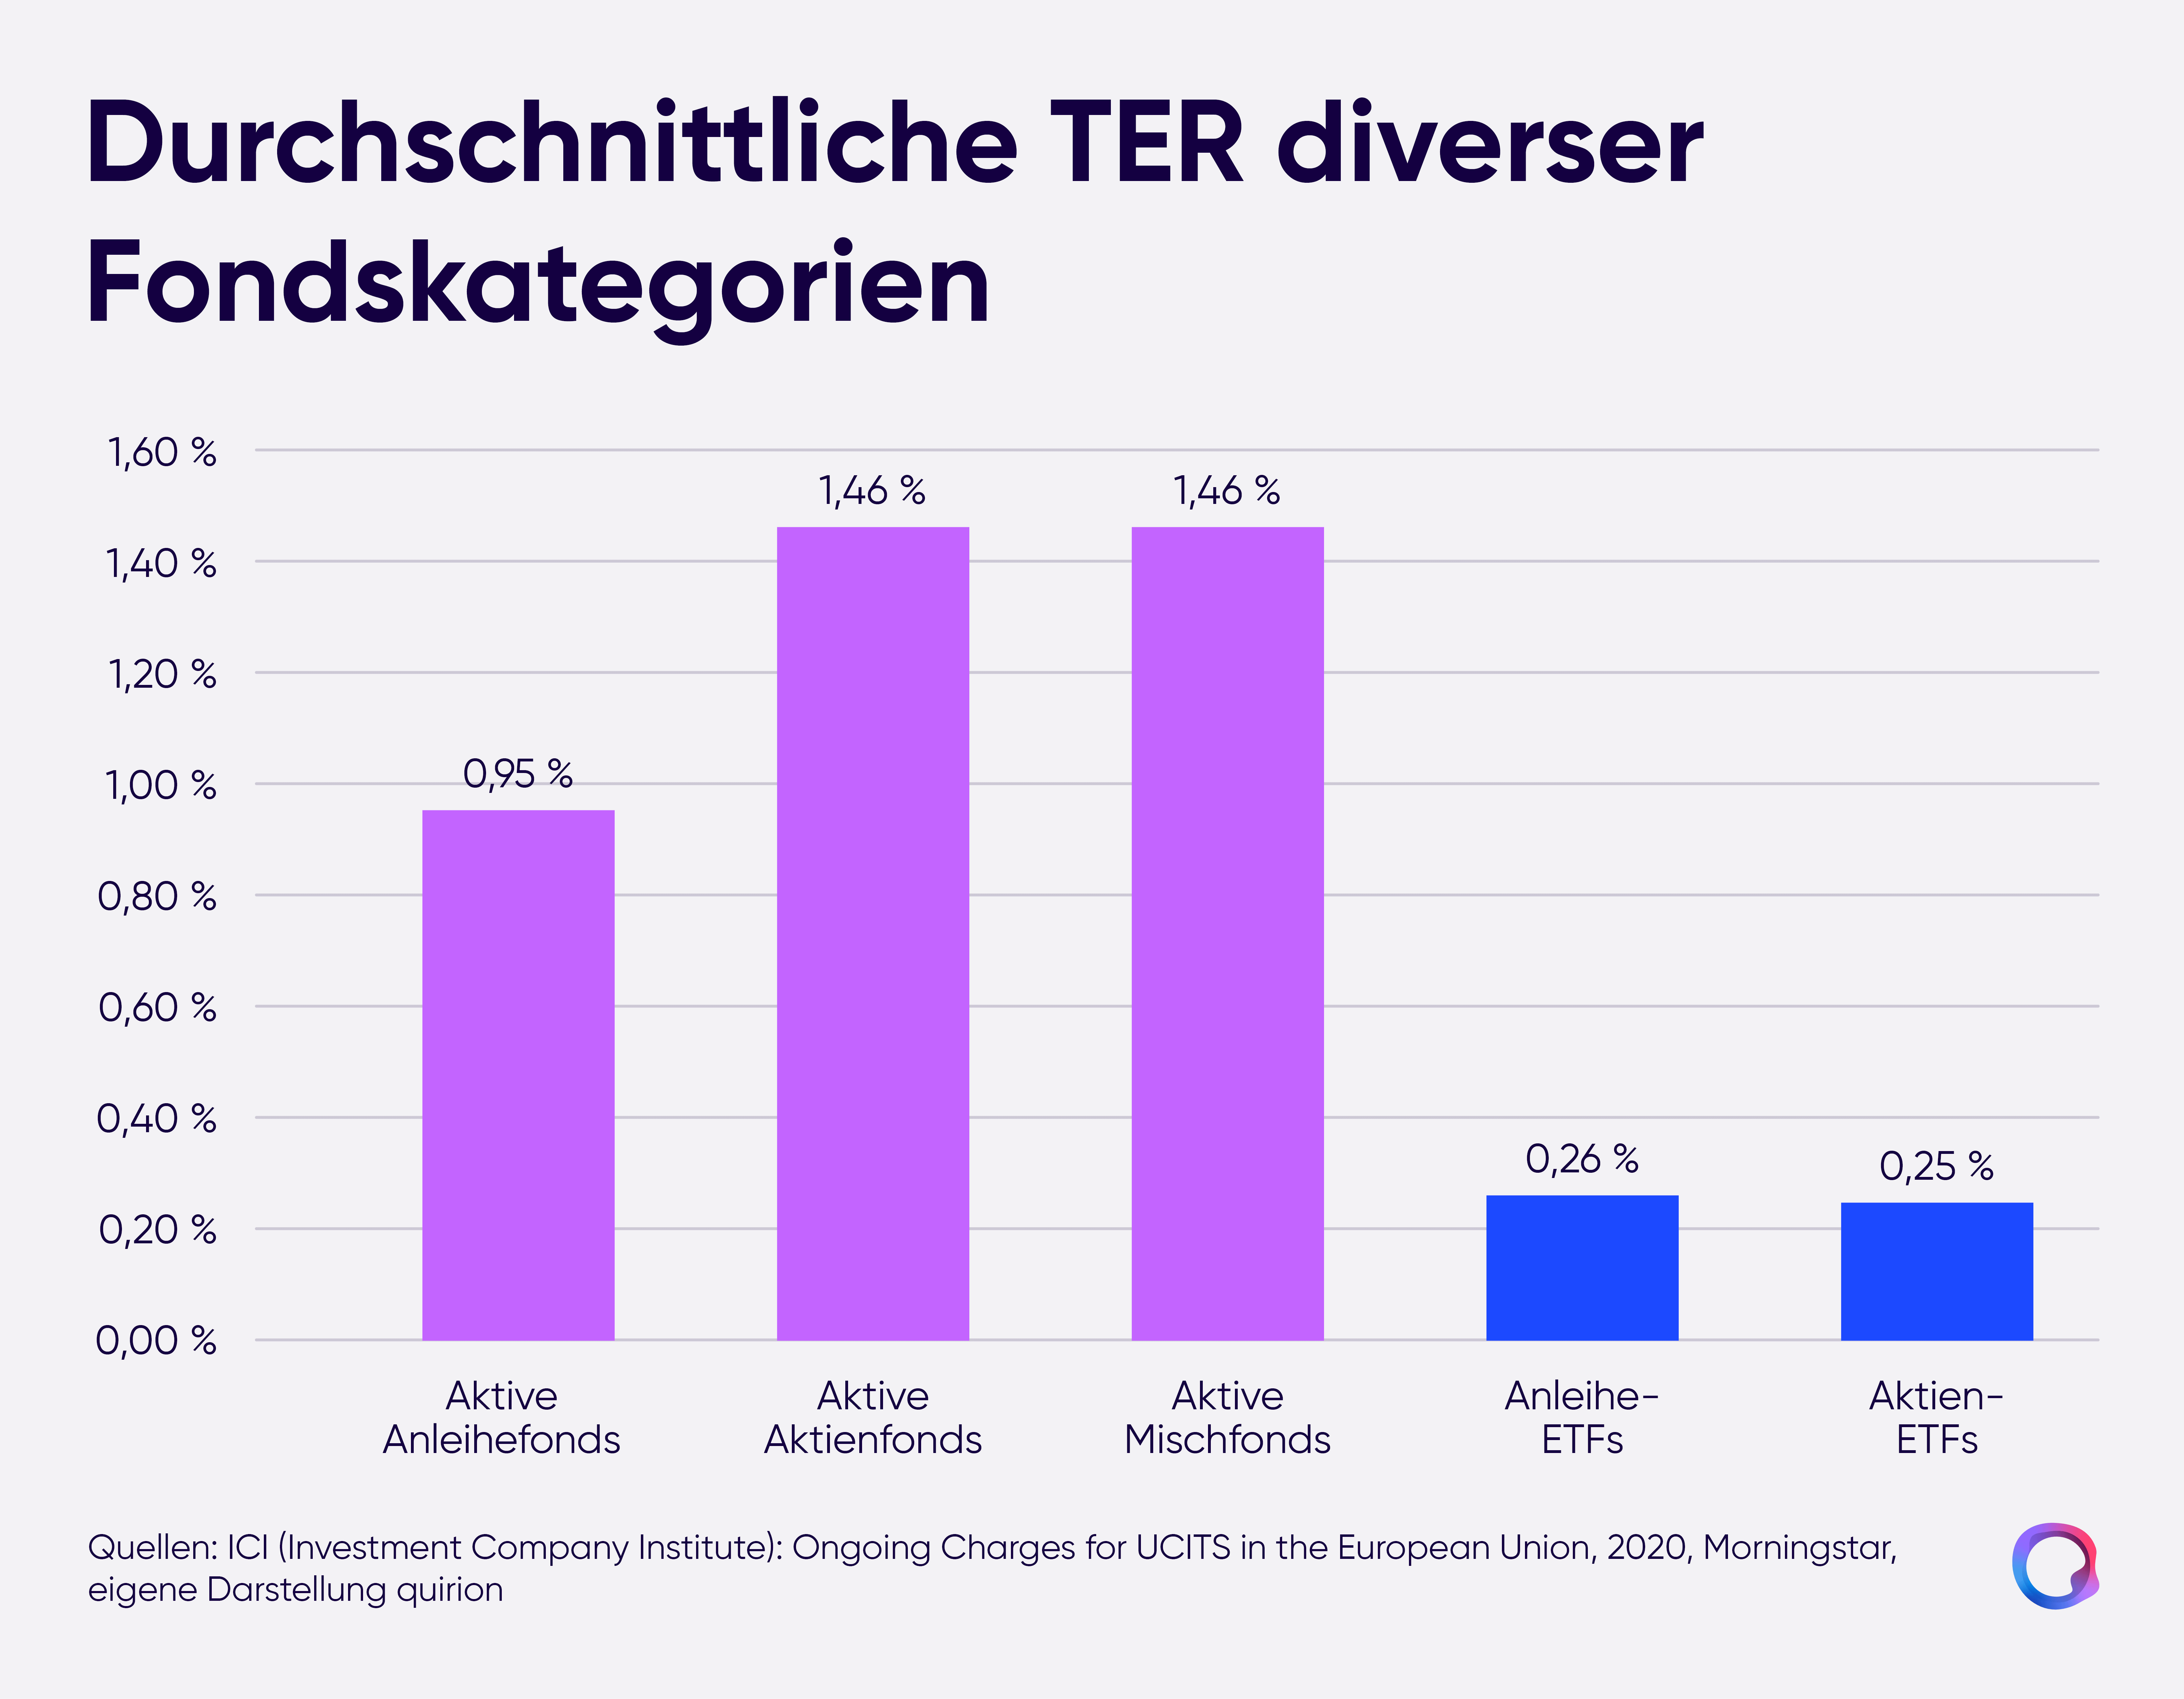
How high the TER is depends, among other things, on the type of fund and on the country of distribution. In principle, actively managed funds are on average considerably more expensive than ETFs. In this country, active funds – depending on the fund's focus – usually move within a range of 0.8 to 2.5 % p.a., with bond funds generally being cheaper than equity funds. For ETFs, the TER usually moves within a range of 0.05 % to 0.8 % p.a. With ETFs, the type of index tracking (replication method) also plays a role in the costs. Physically replicating ETFs are usually somewhat more expensive than synthetically replicating ETFs (swap ETFs).
How can I find out the actual total costs of a fund?
Finding out the full total costs of a fund is unfortunately often laborious, especially when different funds are to be compared with one another. While the TER can still be found clearly on the usual fund profiles produced by investment companies, further cost factors can often only be found in other fund publications.
The return difference, which is meaningful for ETFs, between ETF performance and index performance is also still too little used. In the ETF area, robo-advisors such as quirion can help, in that during product selection they carry out a comprehensive cost assessment, which benefits investors – not only financially, but also in terms of time savings.
Why are the costs of an active fund or ETF so important at all? These are often only deviations at the level of decimal places.
Anyone who, for example, takes a closer look at various ETFs based on the well-known MSCI World Index will find that the differences in cost between the various ETF providers appear relatively small at first glance. Yet even such cost differences are certainly relevant over a longer period, as the following chart illustrates by way of example. It assumes an annual return of 7 % before costs.
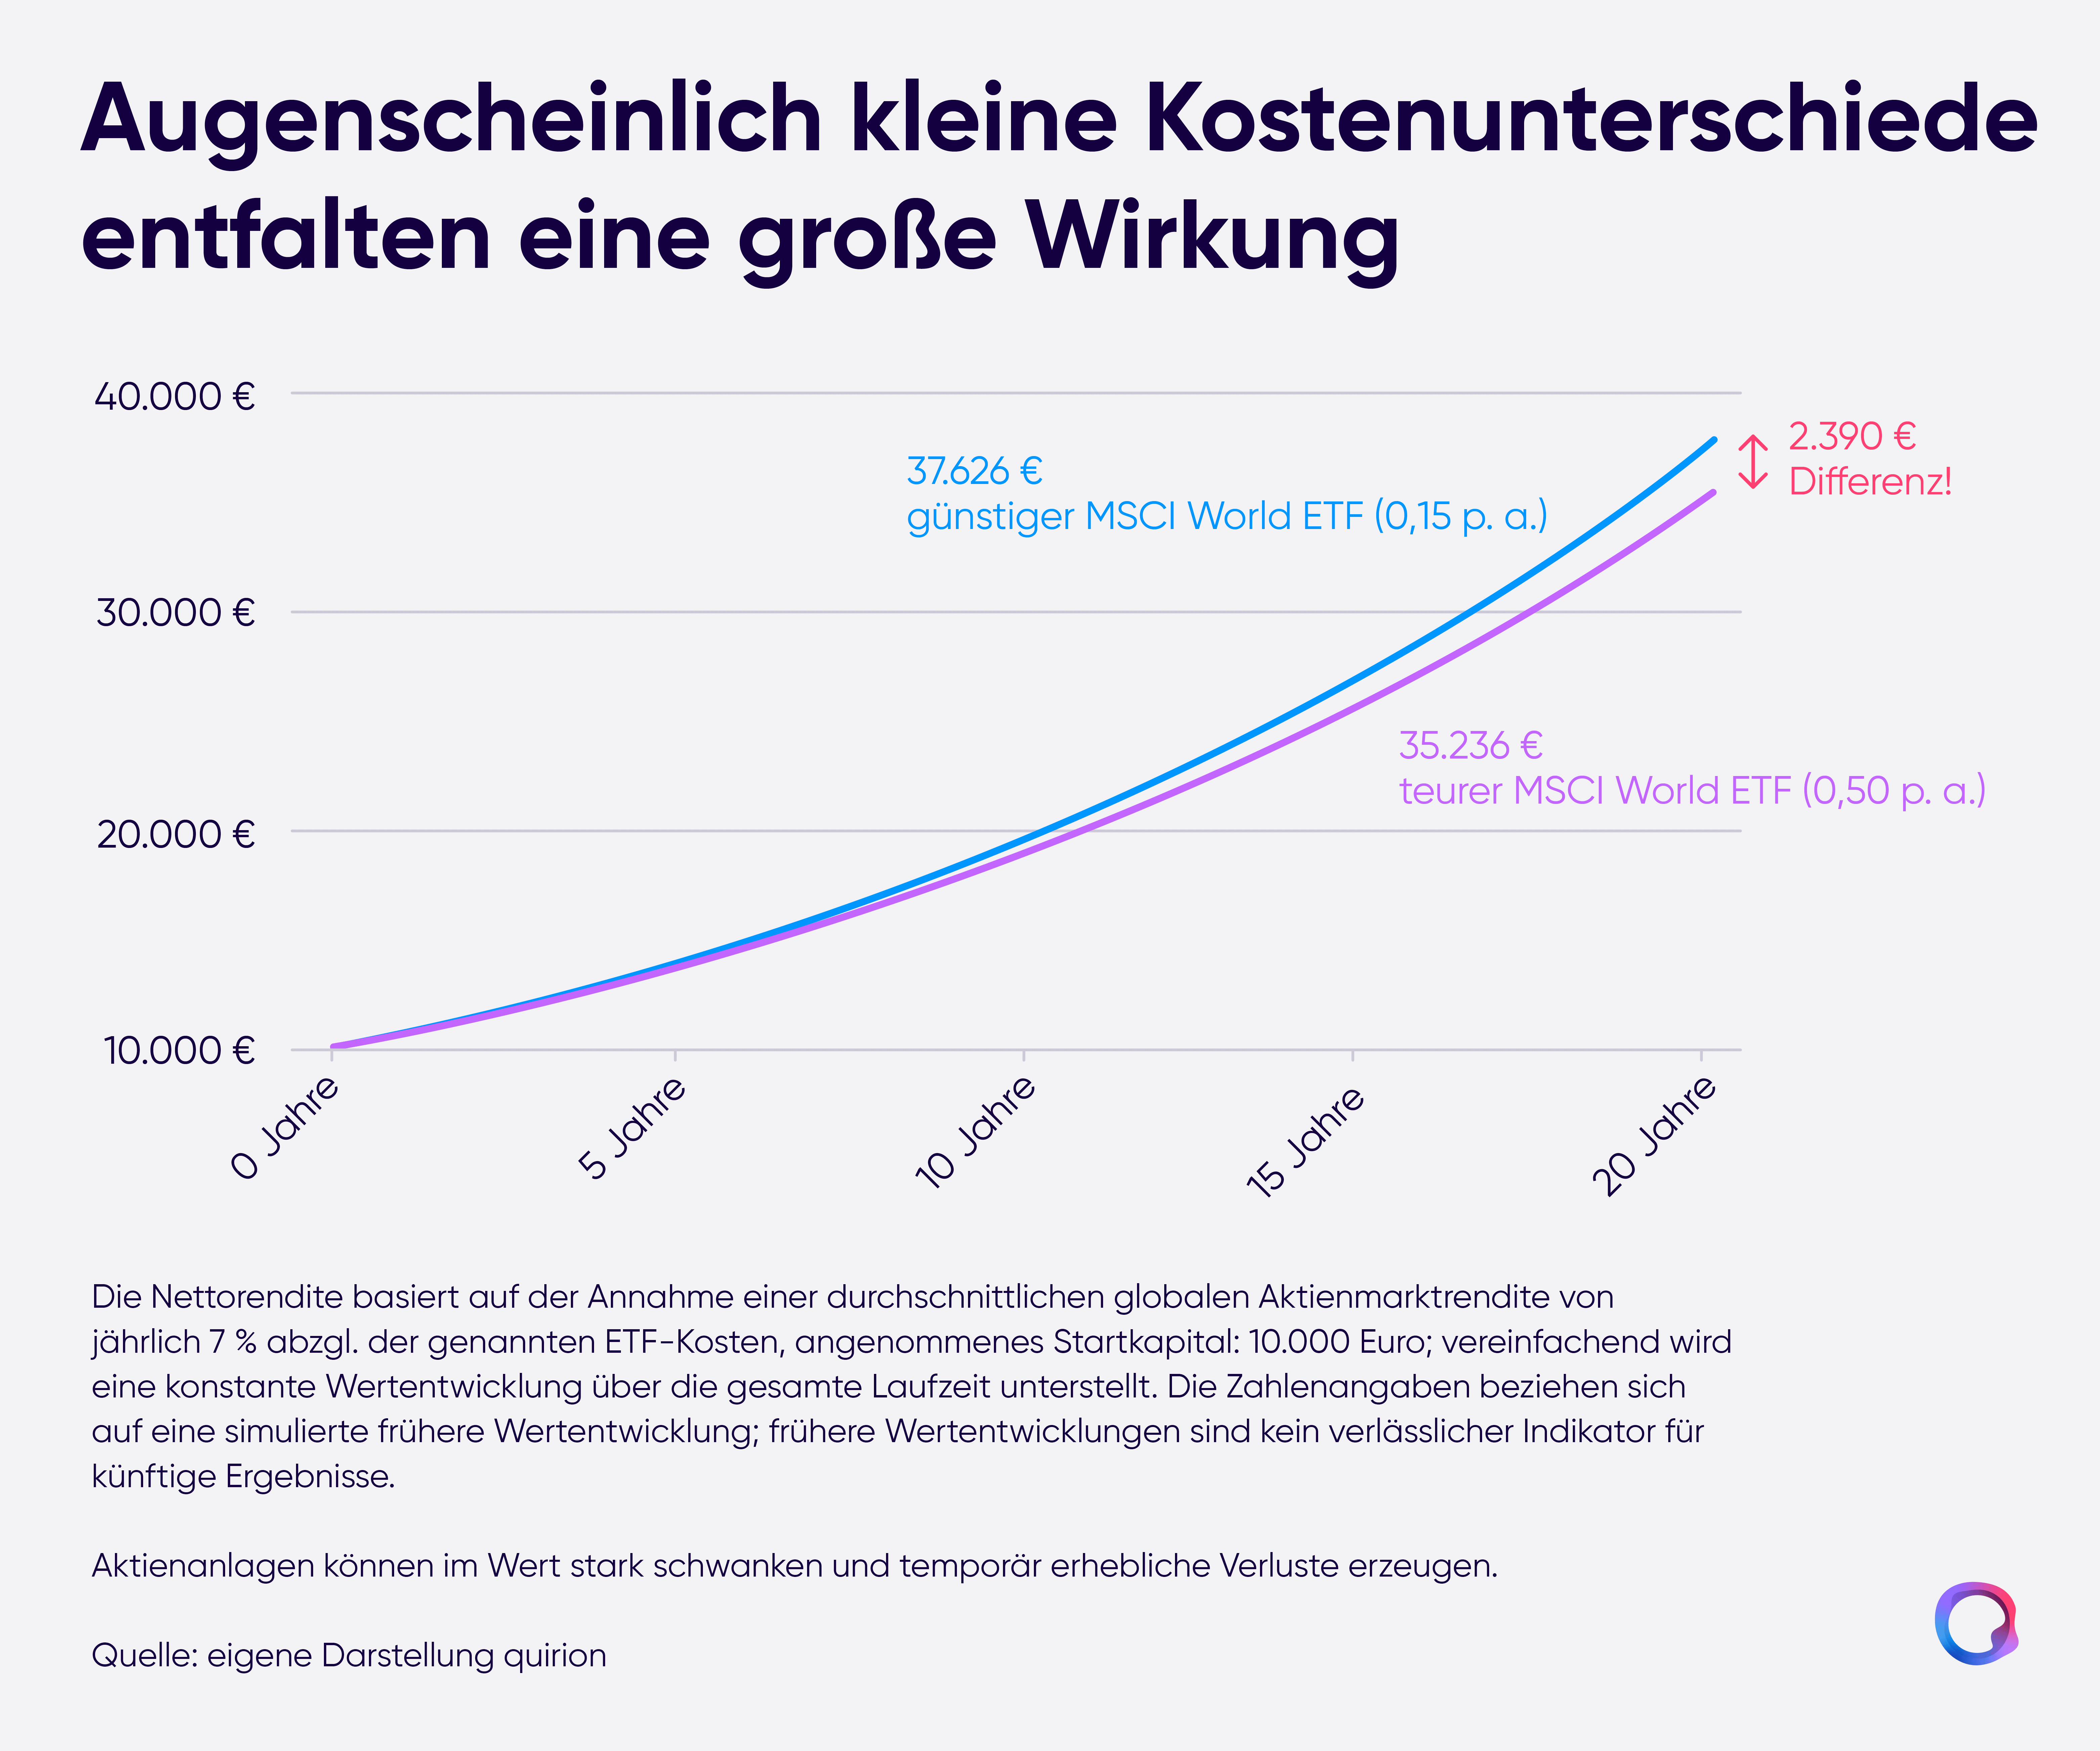
The cost discrepancies between ETFs and comparable, actively managed funds are as a rule considerably larger than those between comparable ETFs. That is why – assuming an equity market return of 7 % p.a. for both fund types – the discrepancies after costs are even larger than in a pure ETF comparison.
In the following chart, the investment success of a 10,000-euro investment is simulated for two different investments.
- Investment in an actively managed equity fund, with calculated costs of 1.5 % p.a. (based on the average TER of equity funds distributed in Germany as per ICI (Investment Company Institute): Ongoing Charges for UCITS in the European Union, 2020; Morningstar)
- Investment in a broadly diversified ETF portfolio with calculated costs of 0.66 % p.a. (based on the TER of quirion's 100 % equity portfolio = 0.18 % p.a. plus the quirion asset management fee in the digital service package = 0.48 % p.a.)
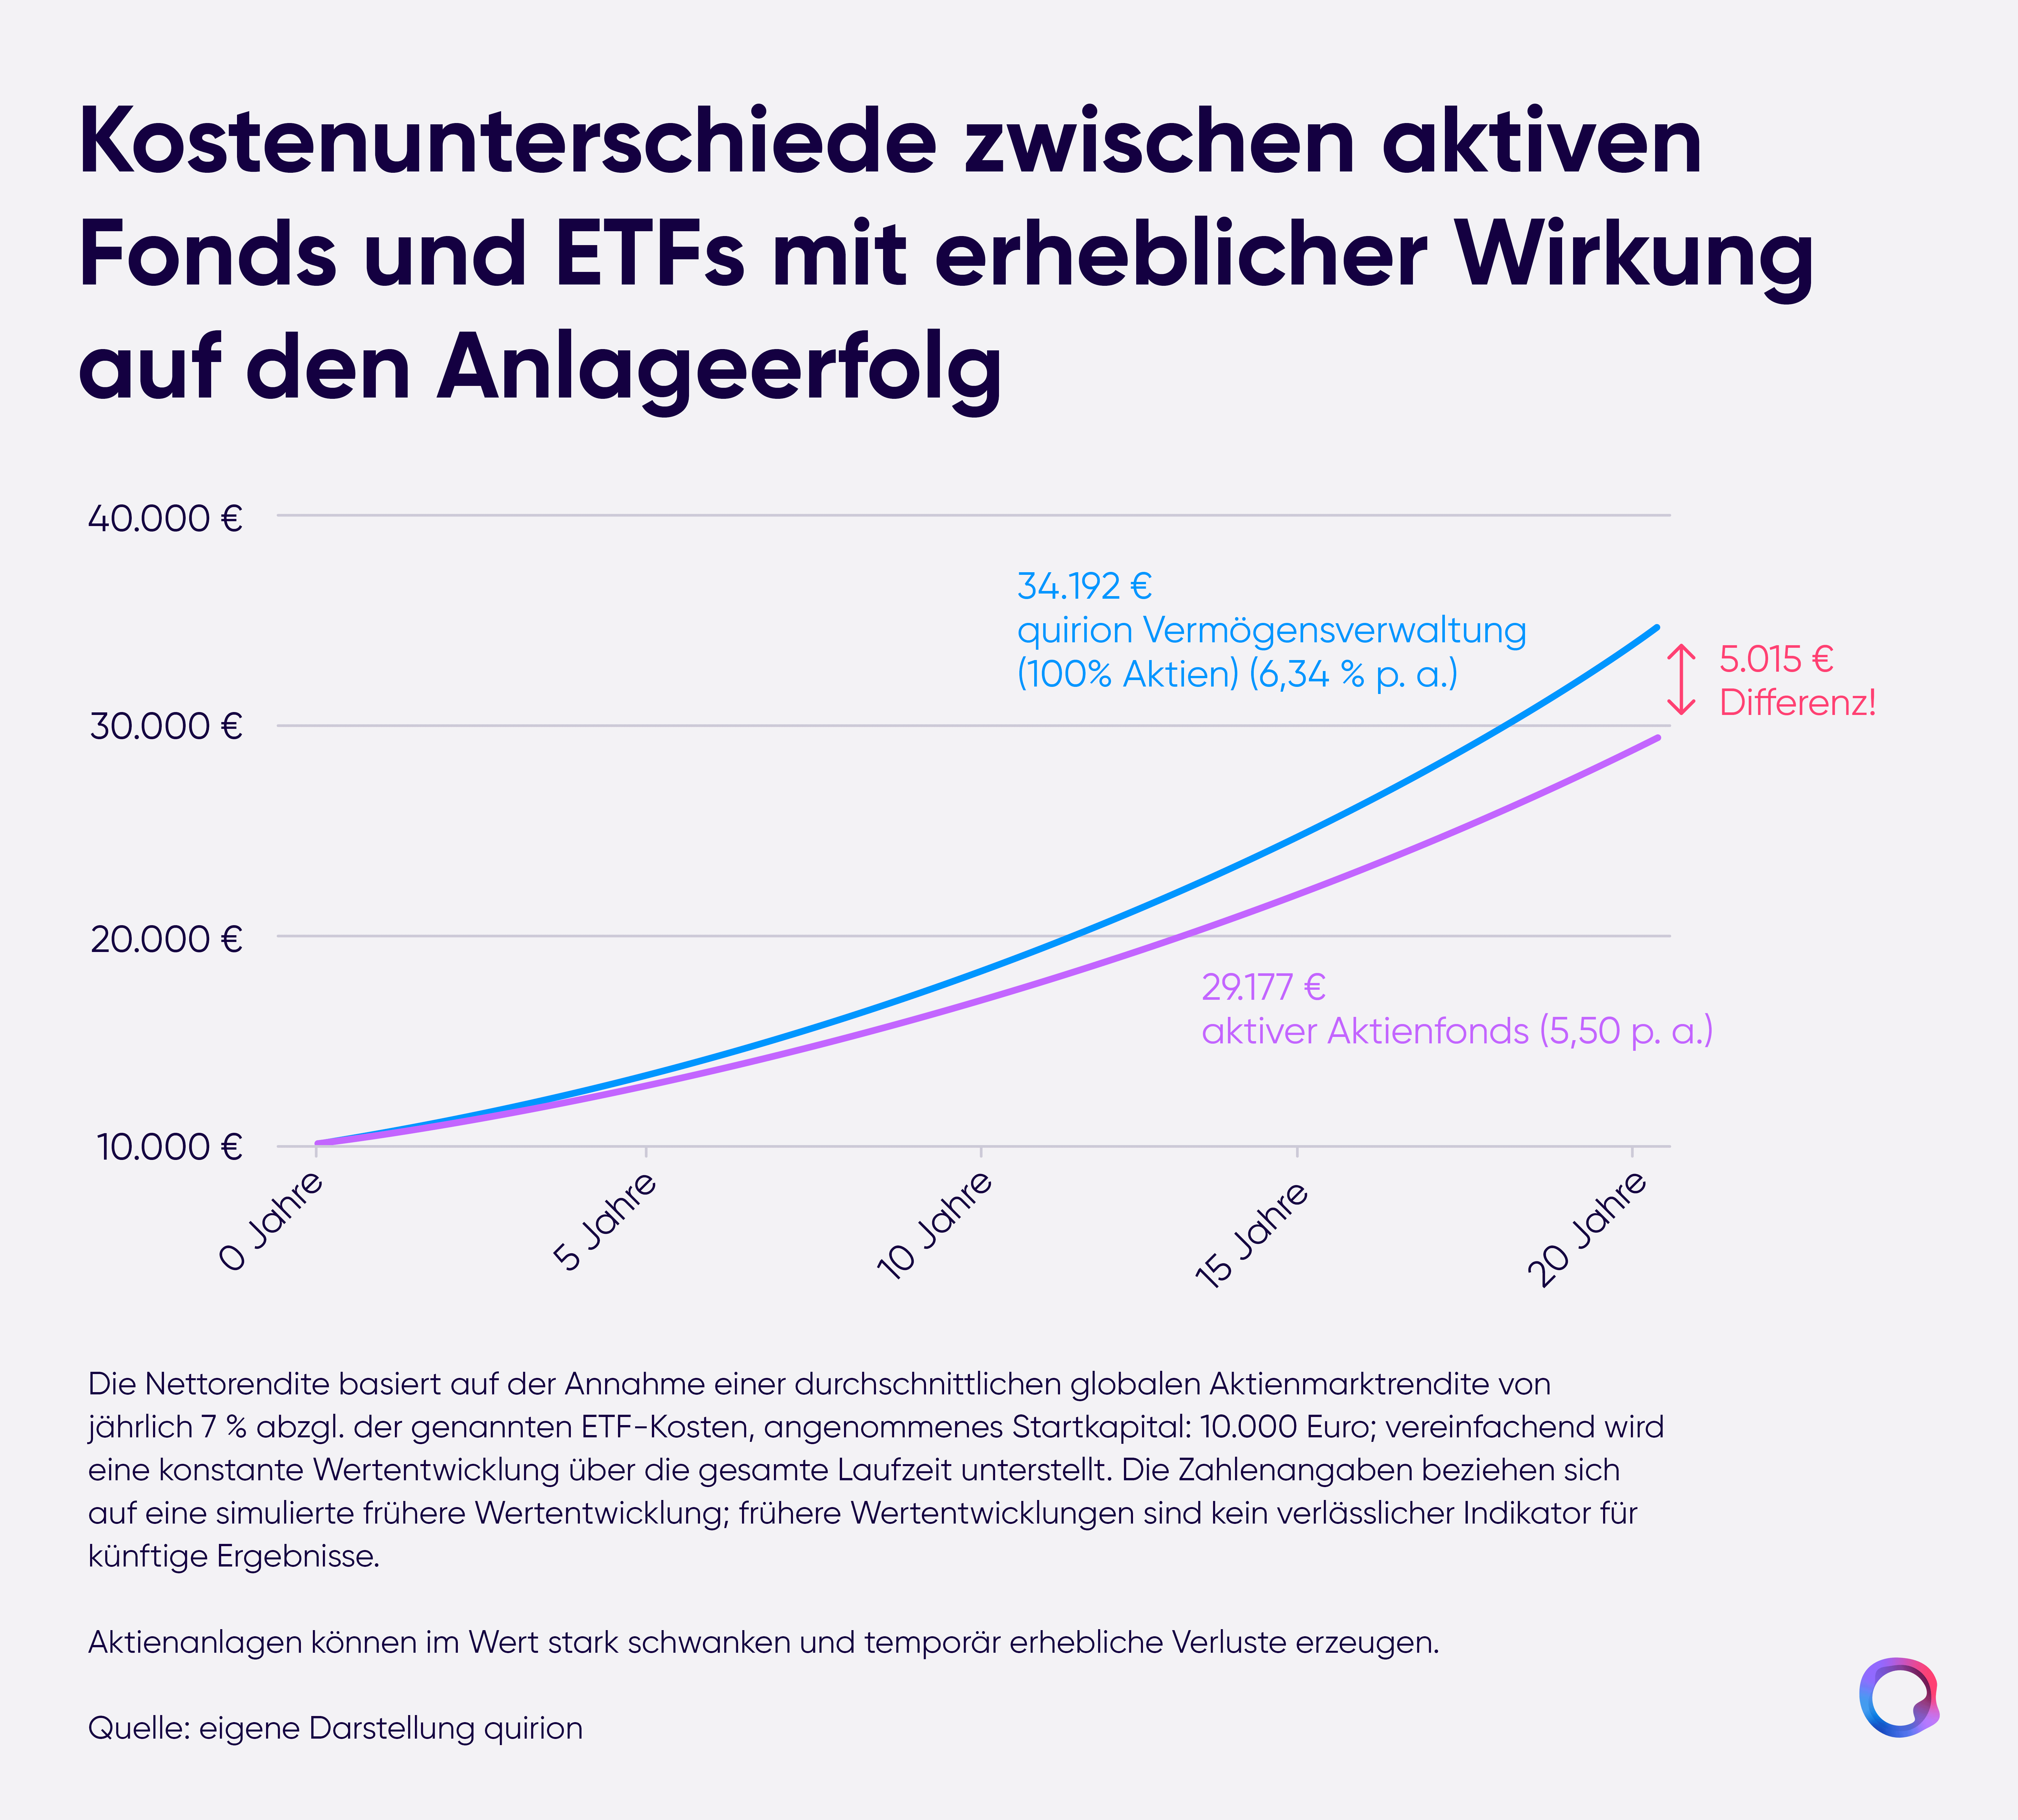
A considerable discrepancy in investment success arises in this example even when the quirion asset management fee is included, for which investors receive various services in return that do not come into play when buying active funds on their own initiative: a portfolio put together according to scientific findings, professional ETF selection, ongoing rebalancing.